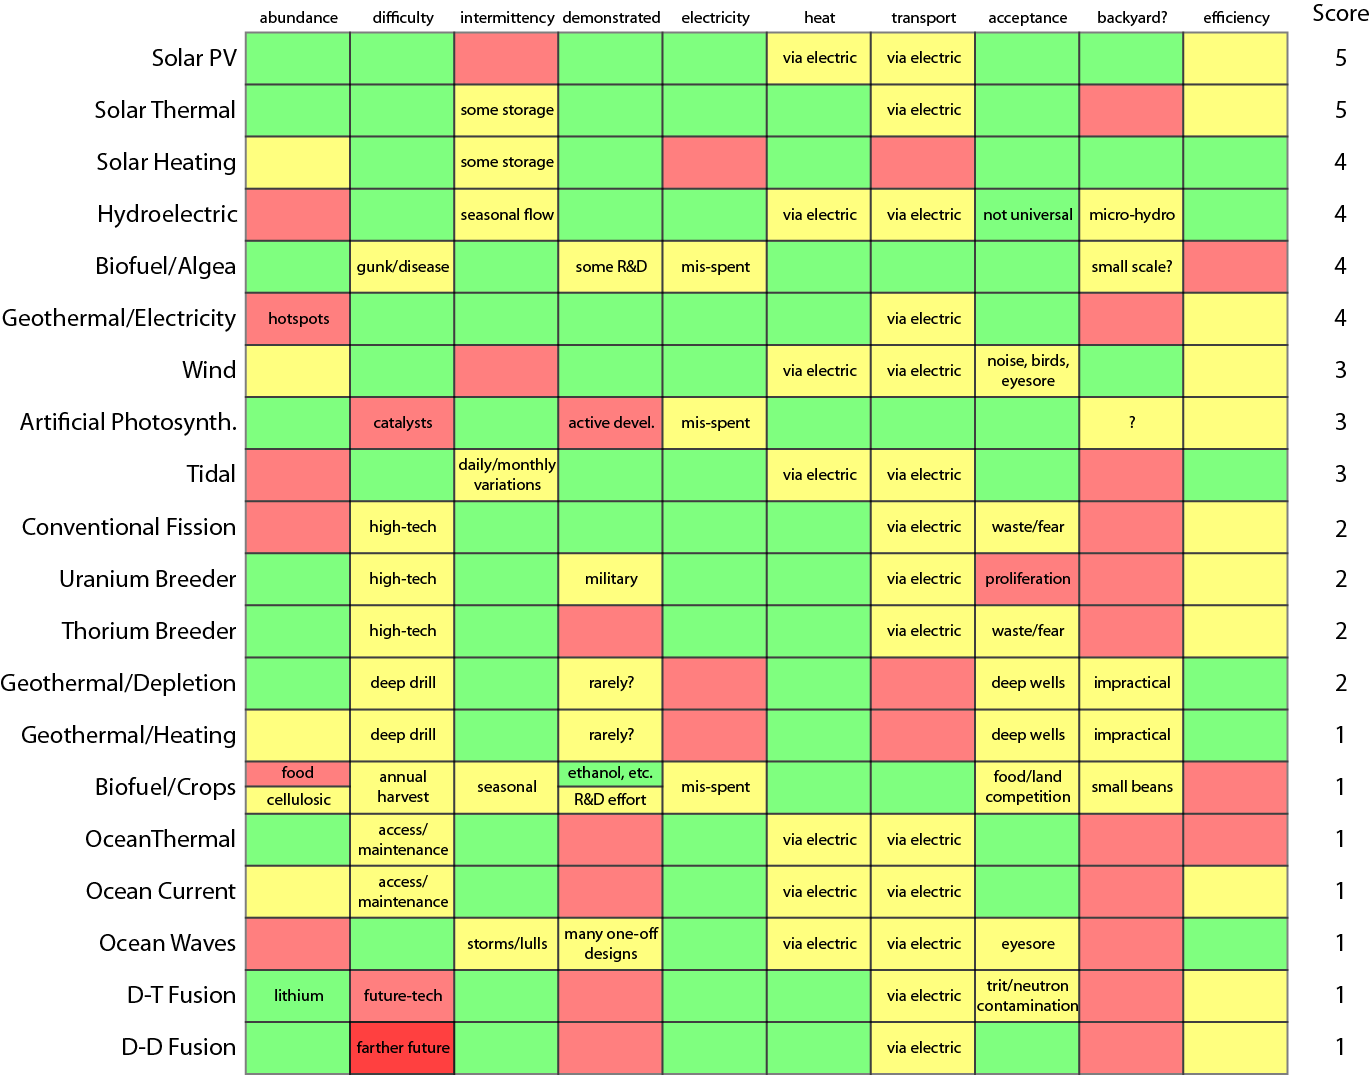
This chart was created by Tom Murphy, who is an Associate Professor of Physics at the University of San Diego. He writes big picture physics analyses of energy solutions.
The chart points out that biofuels, of all sorts, are misspent if they are used for electricity. That’s because there are many ways to make electricity, but there are very few ways to make liquid transportation fuels. Click chart to enlarge.
Notice geothermal. It has the most positive attributes when one considers available hot spots such as we have here on the Big Island.
On top of that, geothermal is a low-cost alternative, says a September 2009 Wall Street Journal blog Environmental Capital. That article asks:
…What price would oil or gas have to be for each technology to be break-even without subsidies, using combined-cycle gas turbines as the low-cost yardstick?
Geothermal is the cheapest: It is competitive with natural gas at $5.16 per million BTUs or oil at $57 a barrel. Nuclear power breaks even at $6.26 and $69.
Traditional, onshore wind power breaks even with gas at $8.33 or oil at $92. Offshore wind still needs a push: It requires gas at $17.14 or oil at $189.
In contrast, solar thermal needs to see natural gas at $35.66 or oil at $393. And good old photovoltaic solar, like the kind on rooftops? Natural gas needs to be at $59.61 or oil at $657 a barrel.

